October 12, 2026
Customer Engagement Metrics That Drive Real Growth

The popular advice is simple: track open rates, clicks, CSAT, NPS, and conversions, then optimize whichever number moves. That dashboard can look healthy while your pipeline deteriorates without warning. An open may not represent attention, a click may reflect curiosity or confusion, and a survey score often represents the people willing to answer rather than the customers you need to understand.
A better definition treats engagement as progression toward a consequential action. For a B2B team, that means separating reach from attention, attention from intent, intent from commitment, and commitment from commercial outcome. The strongest customer engagement metrics don't merely count activity. They show whether the right accounts are moving toward qualified meetings, opportunities, retention, expansion, or revenue.
Table of Contents
- Why Most Customer Engagement Metrics Lists Fail in 2026
- What Counts as an Engaged Session in Modern Analytics
- The Five-Stage Engagement Funnel Every B2B Team Needs
- Volume and Frequency Metrics That Reveal Real Engagement
- Survey-Based Feedback Metrics and How to Calculate Them
- Why Survey Engagement Scores Often Fail to Predict Behavior
- Retention, Churn, and Customer Lifetime Value Calculations
- Digital Product Engagement Metrics for SaaS and Apps
- Benchmarks You Can Actually Trust in 2026
- Building an Engagement Scorecard That Drives Decisions
- Data Hygiene Rules That Keep Your Numbers Honest
- Quick Reference and Decision Checklist
Why Most Customer Engagement Metrics Lists Fail in 2026
A dashboard can report healthy engagement while commercial performance weakens. The underlying error is treating observable activity as customer value. Opens and clicks remain easy to export, but in many teams' experience, privacy changes and modeled attribution have made them less reliable as evidence of buying intent. Industry coverage of customer messaging trends describes a wider measurement gap: revenue attribution was tracked by 34% of respondents, retention or churn by 32%, customer lifetime value by 20%, and engagement scores by 18%.
Survey metrics introduce selection bias. CSAT and NPS describe the people who respond, not necessarily the customers a team most needs to understand. Recent CX coverage reports response rates of roughly 5% to 15%, down from historical levels of about 20% to 25%, and describes a 44% decline after survey volumes increased. Those figures come from recent analysis of survey participation and satisfaction measurement. A score without response-rate context can create false confidence.
Replace the KPI pile with a progression model
Early signals still have diagnostic value. Reach, replies, sessions, and survey responses can show where a journey loses attention. Their role changes when teams connect them to stronger behavioral and commercial outcomes.
Evaluate each metric with four questions:
What happened? A delivered message, session, reply, or survey response.
Who did it? A unique person, account, stakeholder, or duplicated event record.
What happened next? Qualification, booking, attendance, opportunity, renewal, or expansion.
What decision follows? Pause, scale, hold, or investigate.
For Ever Outbound's B2B audience, account-level progression is more useful than one blended engagement score. Target-account coverage, positive-reply quality, stakeholder breadth, qualified-meeting rate, meeting-to-opportunity conversion, sales-cycle velocity, and closed-won revenue show whether activity is creating a measurable commercial path.
Operator's rule: Do not optimize the loudest signal. Optimize the strongest signal your tracking can define cleanly.
What Counts as an Engaged Session in Modern Analytics
A useful engagement definition starts with the session, not with one isolated interaction. Google Analytics 4 classifies a session as engaged when at least one of three conditions is satisfied: it lasts longer than 10 seconds, includes at least one designated key event, or contains at least two pageviews or screenviews. Google's GA4 documentation also defines engagement rate as engaged sessions divided by total sessions, while bounce rate represents the inverse proportion of sessions that weren't engaged.
That model gives teams a practical template:
Define the session boundary. State when a session starts, ends, and becomes eligible for analysis.
Name the key events. Use actions that indicate meaningful progress, not every available interaction.
Publish the denominator. Record whether the rate uses delivered messages, sessions, accounts, users, or another base.
Deduplicate before reporting. Assign stable identifiers to replies, meetings, accounts, and event deliveries.
For an outbound command center, campaign-specific key events might include a positive reply, completed qualification, calendar booking, attended meeting, or closed-won opportunity. Opens and clicks can remain diagnostic signals, but they should sit below these stronger actions in the reporting hierarchy.
Avoid the zombie-session trap
GA4 warns that artificially keeping sessions open can create “zombie sessions”, which falsely increase engagement rate. Outbound systems have parallel failure modes: repeated webhook events, duplicate replies, and meetings rescheduled multiple times can all inflate apparent engagement.
The implementation rule is simple. Document the event definition, attribution window, denominator, identity key, and deduplication logic for each metric. Without that record, a campaign can appear to improve merely because the tracking system changed.
The Five-Stage Engagement Funnel Every B2B Team Needs
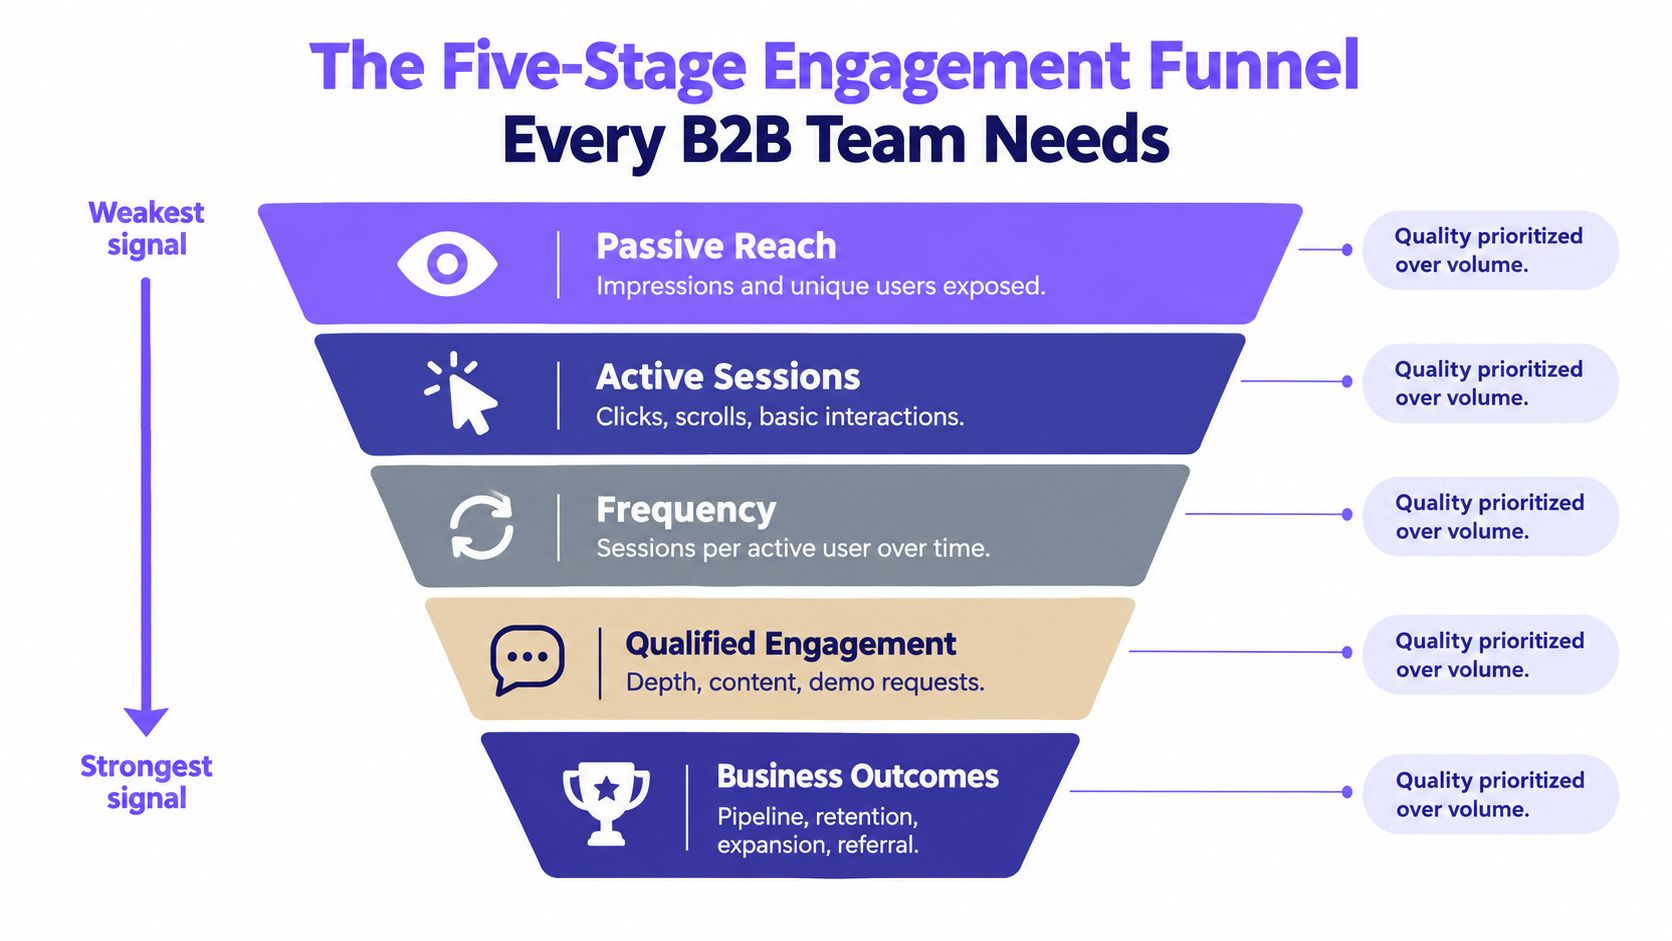
A B2B funnel should rank signals from weakest to strongest, while preserving the relationship between stages. The practical sequence is reach, attention, intent, commitment, and commercial outcome. Each stage needs its own denominator, because a rate becomes misleading as soon as teams change the population behind it.
Start with exposure, then demand evidence
Reach measures delivery and coverage. Track delivered messages and unique reached accounts. A delivery rate can be written as delivered messages divided by sent messages, while account coverage is unique reached target accounts divided by target accounts. These metrics tell you whether the campaign entered the intended market, not whether buyers cared.
Attention captures a response. Use unique replies and reply rate, calculated as unique replies divided by delivered messages. Count unique people or accounts according to the decision you're making, and don't let repeated messages from one contact masquerade as broad interest.
Intent filters attention for buying relevance. Positive-reply rate equals unique positive replies divided by delivered messages. Qualification rate equals qualified positive replies divided by unique positive replies. The second denominator matters, because a high reply volume can coexist with poor fit.
Commitment records a costly action. Booking rate equals qualified meetings booked divided by qualified positive replies. Show rate equals attended meetings divided by booked meetings. A booked calendar slot is weaker than an attended conversation, so the dashboard should make that distinction visible.
Commercial outcome connects engagement to economics. Opportunity rate equals opportunities divided by attended qualified meetings. Close rate equals closed-won deals divided by attended qualified meetings. Revenue per contacted account divides closed revenue by contacted accounts, while customer-acquisition cost should be reported against the agreed acquisition-cost definition.
Cut every stage by cohort
One blended funnel can hide the decision you need. Report cohorts by client, vertical, offer, geography, mailbox domain, and campaign version. A segment with many replies but weak qualification or show rates deserves scrutiny. A smaller segment that progresses consistently to attended meetings and closed revenue may deserve more capacity.
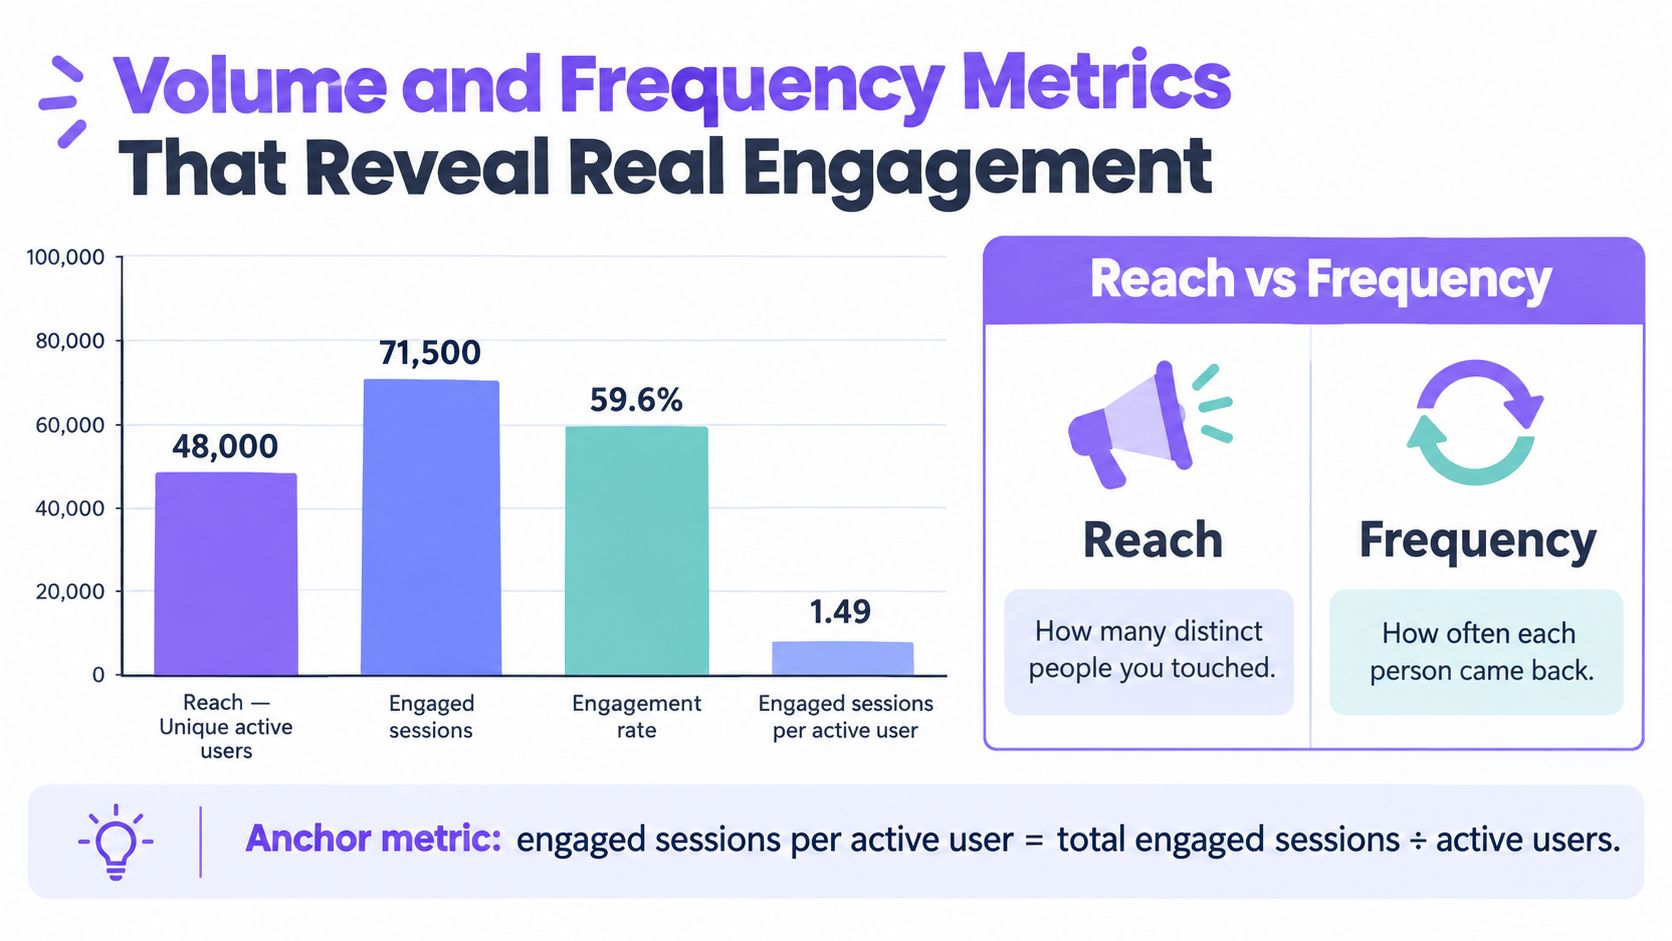
The framework also supports frequency analysis. Google's documentation on engaged sessions per active user illustrates why teams should report both total activity and repeated engagement rather than relying on one volume figure.
Volume and Frequency Metrics That Reveal Real Engagement
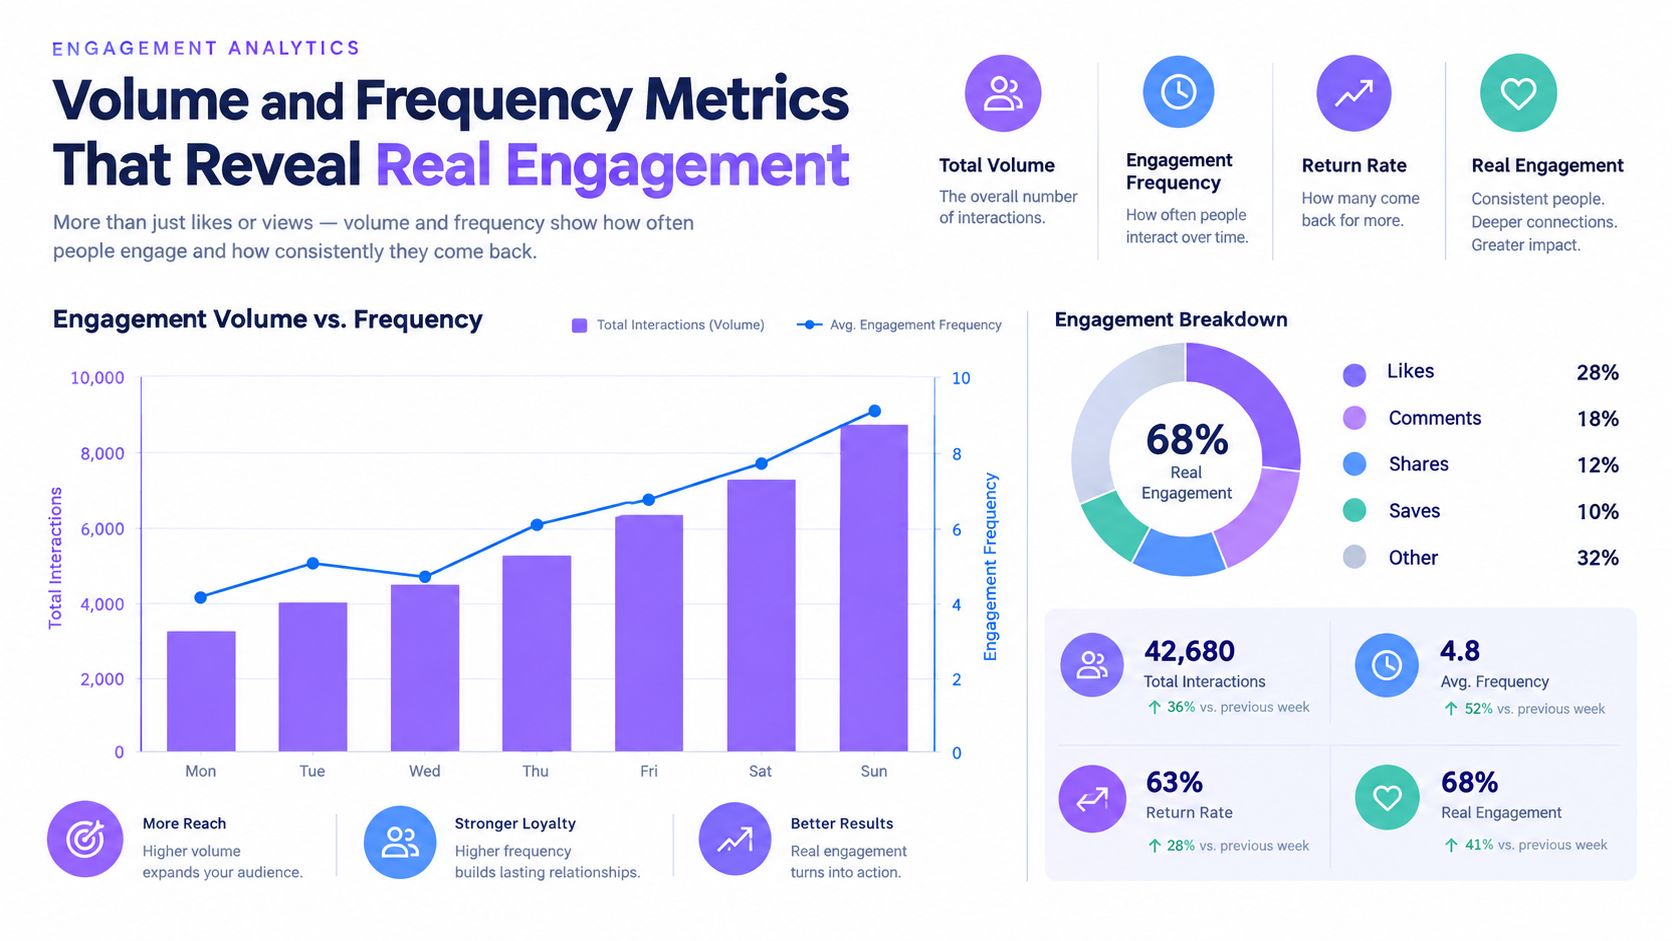
Reach answers, “How many distinct accounts or users did we touch?” Frequency answers, “How often did each person or account return or engage?” Combining them prevents two opposite errors: declaring victory because exposure is broad, or mistaking repeated activity from a narrow audience for market-wide traction.
For digital analytics, define engagement rate as engaged sessions divided by total sessions. Define frequency as engaged sessions per active user, calculated as engaged sessions divided by active users. For B2B outreach, use the same logic at account level where possible: unique engaged accounts show breadth, while engaged events per engaged account show depth.
A high-reach, low-frequency pattern usually indicates broad exposure without sustained interaction. A low-reach, high-frequency pattern can indicate strong interest in a narrow segment, but it can also signal repeated follow-ups, unresolved friction, or duplicate events. Neither pattern is automatically good or bad. The next commercial action determines its value.
Use the diagnostic pair
| Pattern | Likely interpretation | Next question |
|---|---|---|
| Broad reach, shallow frequency | Awareness without depth | Does the offer generate replies or qualified actions? |
| Narrow reach, deep frequency | Strong interest or repeated friction | Are accounts progressing, or looping through the same interaction? |
| Broad reach, deep frequency | Stronger distribution and depth | Does the behavior produce pipeline? |
| Narrow reach, shallow frequency | Limited coverage and weak response | Is the segment, offer, or channel wrong? |
For an outbound team, account breadth should be paired with stakeholder breadth. One engaged contact may not represent buying-group engagement. Multiple relevant stakeholders participating in a campaign can provide stronger evidence that an account is developing intent.
Capacity planning should reflect this distinction. Ever Outbound's outbound volume planner can sit alongside a scorecard that separates sending volume from unique account progression. The planner answers how much activity is possible. The funnel answers whether that activity is worth expanding.
Survey-Based Feedback Metrics and How to Calculate Them
Surveys are useful when they answer a narrow question at a defined touchpoint. They become dangerous when a team turns one response into a portrait of an entire account.
CSAT measures positive satisfaction responses. On a five-point scale, calculate it as respondents rating 4 or 5 divided by total respondents, multiplied by 100. If 64 of 100 respondents select 4 or 5, the CSAT is 64%. That example describes the formula, not a benchmark.
NPS measures stated advocacy. Promoters select 9 or 10 on a zero-to-ten question, detractors select 0 through 6, and passives select 7 or 8. Calculate NPS as the percentage of promoters minus the percentage of detractors.
CES measures perceived effort at a specific interaction. Add the effort scores and divide by the number of responses. Define the scale direction before analysis, because a higher score can mean either more effort or greater ease depending on the question design.
Response rate equals completed survey responses divided by customers surveyed, multiplied by 100. It tells you participation, not satisfaction quality.
Survey metrics quick reference
| Metric | Formula | When to use | Key weakness |
|---|---|---|---|
| CSAT | Positive responses ÷ total responses × 100 | After a defined interaction | Sensitive to timing and respondent selection |
| NPS | Promoter percentage minus detractor percentage | Advocacy and relationship direction | Stated intent may not predict behavior |
| CES | Total effort scores ÷ responses | Onboarding, support, or feature friction | Scale interpretation can vary |
| Response rate | Completed responses ÷ surveyed customers × 100 | Assessing participation | Doesn't prove representativeness |
Small samples, post-positive-event sampling, and respondent survivorship can make the result look cleaner than the underlying customer experience. Teams looking for a practical treatment of fixing bias in CSAT scores should examine who answered, who didn't, and when the request was sent.
Why Survey Engagement Scores Often Fail to Predict Behavior
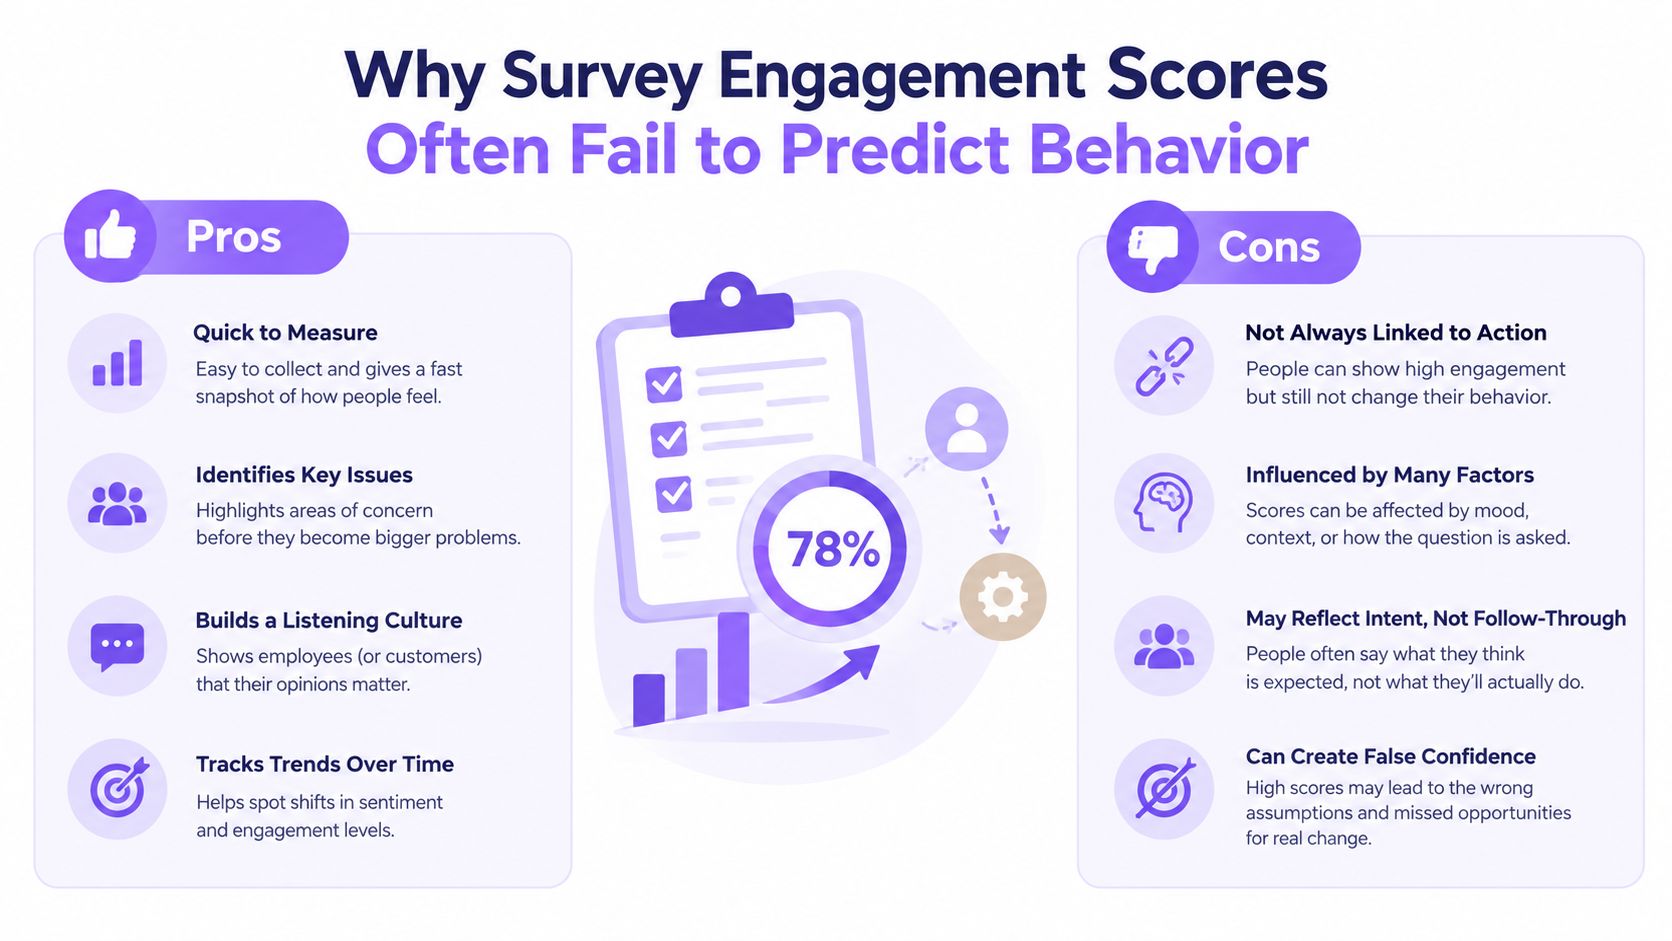
A survey score measures respondents, not customer engagement across an account base. Angry, delighted, available, or frequently contacted customers may answer at higher rates than customers who are disengaging without saying so. The result can reflect participation bias as much as sentiment.
Timing creates a second distortion. A survey sent immediately after a positive support interaction may produce a favorable score while missing an earlier failure. Sampling only satisfied users can improve the report without improving the product or service.
Measurement test: Ask whether the score predicts a consequential action for both respondents and nonrespondents.
Keep surveys in the measurement system, but give them a supporting role. Use short, event-triggered questions, then connect responses with behavioral and commercial records. Check response representativeness, recency, completeness, consistency with observed usage, time from insight to action, renewal or expansion behavior, and lift in controlled experiments.
Add the trust layer
Privacy changes the exchange required to collect data. PwC reports that nine in ten consumers are willing to share some personal data for personalization, provided the organization's collection and use are clear and the customer receives a tangible benefit.
For B2B teams, explain why feedback is requested and separate individual sentiment from account-level engagement. One respondent cannot represent an entire buying group. Combine stakeholder participation, product usage, meeting progression, renewal behavior, and carefully sampled feedback before assigning an account an engagement status. That status should gain confidence when survey responses align with observed actions, and lose confidence when stated satisfaction conflicts with usage or commercial outcomes.
Retention, Churn, and Customer Lifetime Value Calculations
Engagement earns its place on an executive dashboard when it explains durable commercial behavior. Retention, churn, and customer lifetime value translate repeated usage, successful outcomes, and relationship health into financial language.
Retention rate measures the share of starting customers retained through a period, excluding new customers added during that period:
Retention rate = (Ending customers - New customers) ÷ Starting customers × 100
Logo churn measures customers lost divided by starting customers. Revenue churn uses lost recurring revenue divided by starting recurring revenue. Keep logo and revenue churn separate because losing several small accounts and losing one large account carry different economic consequences.
Customer lifetime value can use the operating formula:
CLV = Average purchase value × Average purchase frequency × Average customer lifespan
For subscription businesses, teams may instead use a contribution-margin model tied to recurring revenue and retention assumptions. The formula matters less than documenting which version the finance and growth teams accept.
Customer-acquisition cost equals acquisition and sales costs divided by acquired customers for the defined period. Compare CAC with CLV only when both use compatible time windows, customer definitions, and cost categories.
Read the curve, not the company average
A company-wide retention number can hide a damaged cohort behind a healthy installed base. Build retention curves by signup month, acquisition source, plan, vertical, or onboarding path. Then compare early engagement behavior with later renewal, expansion, or contraction.
That approach changes the question from “Are customers retained?” to “Which first experiences create customers who remain valuable?” A cohort with strong early feature adoption but weak expansion may need packaging or education. A cohort with modest initial activity but strong renewal may value a different workflow.
The same discipline applies to outbound. Track whether accounts that show qualified engagement become opportunities and closed-won customers, then compare revenue per contacted account with acquisition cost. Engagement is not the outcome, but it can identify the behaviors that precede the outcome.
Digital Product Engagement Metrics for SaaS and Apps
Product teams often choose between breadth and depth as if they were competing philosophies. DAU, WAU, and MAU measure distinct active users in daily, weekly, and monthly windows. They describe usage coverage, but they don't show whether users complete a valuable workflow.
The common stickiness ratio is:
DAU ÷ MAU
It estimates how frequently monthly active users return on a daily basis. A team can also use WAU against MAU when weekly behavior better reflects the product's natural use cycle.
Session depth equals meaningful actions, screens, or steps per session, provided the team defines which actions count. Feature adoption rate equals users who used a feature at least once divided by the relevant eligible user base. Feature stickiness can measure repeat feature users divided by feature adopters, or another documented repeat-use denominator.
Pair breadth with depth
MAU can rise while meaningful usage remains flat. Session depth can rise while the product serves only a narrow power-user group. Put the measures together:
Reach layer: active users, new users, and eligible accounts.
Usage layer: sessions, session depth, and return frequency.
Value layer: completion of the core workflow, feature adoption, and repeat use.
Outcome layer: renewal, expansion, or another commercial event.
The right combination depends on the product's growth stage. Early teams need evidence that target users can reach and activate the core experience. Scaling teams need repeat behavior and feature adoption by cohort. Mature teams should connect product engagement to retention, expansion, and account health.
A long session isn't automatically healthy. It can reflect discovery, but it can also indicate friction. Pair duration with completion, support contact, and repeat behavior before treating depth as success.
Benchmarks You Can Actually Trust in 2026
External benchmarks are calibration points, not performance targets. Survey participation can vary widely by audience, channel, relationship strength, and request timing. An external range may reveal measurement pressure, but it cannot establish whether respondents represent your customer base. The same applies to reported rates for revenue attribution, retention or churn tracking, customer lifetime value, and engagement scoring. Treat them as prompts to inspect what your program measures, not as evidence that a campaign succeeded.
Your own cohorts provide the stronger reference. Compare response, activation, qualification, retention, or expansion across comparable groups, then check whether the difference persists through the next commercial stage. A benchmark becomes useful when it helps identify an abnormal shift or a missing measurement layer.
For outbound, calculate positive-reply and qualified-meeting rates from delivered messages, then segment results by market, offer, list quality, geography, mailbox domain, campaign version, and qualification rule. These variables change both the denominator and the expected pattern. Pair top-of-funnel movement with opportunity creation and revenue, because activity can improve while pipeline remains unchanged.
Document each comparison before interpreting it:
Population: accounts, contacts, users, or sessions.
Channel: email, product, support, paid media, or mixed.
Event definition: what qualifies as positive, qualified, active, or retained.
Window: the period between exposure and outcome.
Cohort: the market, offer, plan, or acquisition source included.
Use Ever Outbound's cold email grader as a diagnostic input, then validate its implications against qualification and revenue data. Cohort movement usually gives a clearer decision signal than an industry average.
Building an Engagement Scorecard That Drives Decisions
A useful scorecard has four columns: metric, formula, current value, and decision trigger. If the fourth column is missing, the dashboard is probably reporting rather than managing.
For an outbound program, the top rows might be delivered messages and unique reached accounts. The middle rows should include unique replies, positive replies, qualification, bookings, and show rate. The bottom rows should contain opportunities, closed-won deals, revenue per contacted account, and acquisition cost. Each row needs a trigger, such as pause a low-qualification segment, scale a high-show cohort, hold a stable test, or investigate a sudden tracking change.
A SaaS scorecard uses a different event vocabulary but the same logic. Pair active users with activation, core-workflow completion, repeat feature use, and cohort retention. A rise in MAU without stronger completion should trigger investigation, not celebration.
Make the slice operational
Never let the blended average decide for every cohort. Add filters for client, vertical, offer, geography, mailbox domain, campaign version, plan, signup month, and acquisition source. Then assign actions to the slice that crossed the trigger.
A metric earns dashboard space only when someone can name the action it changes.
The scorecard should fit on one page, but it doesn't need to contain every event. Prioritize downstream outcomes, then the strongest leading indicators that explain them. Ever Outbound's results page can be reviewed alongside a scorecard when evaluating how campaign activity, replies, and booked calls relate to commercial progress.
Data Hygiene Rules That Keep Your Numbers Honest
Most dashboard errors aren't advanced statistical failures. They're definition failures that enter upstream and become polished charts downstream.
Document the denominator. Write “positive replies divided by delivered messages,” not merely “positive-reply rate.” A rate without its base can't be compared across campaigns.
Freeze the attribution window. Decide how long after an outreach event a reply, booking, opportunity, or close remains attributable. Changing the window during a comparison can manufacture improvement or decline.
Deduplicate at the source. Repeated webhook events, duplicate replies, and rescheduled meetings should resolve to stable event identities before aggregation. A reporting-layer fix can conceal the same defect in another dashboard.
Version metric definitions. Store the definition, owner, start date, and change reason. When a qualification rule changes, the scorecard should show a version boundary instead of pretending the time series is continuous.
Run a quarterly audit across campaigns, markets, and client accounts. Check denominators, attribution windows, event IDs, identity resolution, time zones, qualification rules, and definition versions. Review deliverability separately with an email deliverability checker, because a reach problem can look like an engagement problem after delivery falls.
Quick Reference and Decision Checklist
The funnel is the shortest useful summary:
Reach: delivered messages and unique reached accounts.
Attention: unique replies and reply rate.
Intent: positive-reply rate and qualification rate.
Commitment: booking rate and show rate.
Commercial outcome: opportunity rate, close rate, revenue per contacted account, and CAC.
For surveys, CSAT is positive responses divided by total responses, NPS is promoter percentage minus detractor percentage, CES is total effort score divided by responses, and response rate is completed responses divided by surveyed customers. For products, DAU, WAU, and MAU measure active-user breadth, while DAU divided by MAU expresses a documented form of stickiness. Feature adoption requires feature users divided by the eligible user base.
Before adding a metric, ask:
Does it have a named denominator?
Is the attribution window fixed?
Is there a deduplication rule?
Is the definition versioned?
Which decision does it trigger?
Can the team cut it by the cohort that matters?
Does it predict a stronger behavioral or commercial signal?
Avoid three recurring mistakes. Don't report vanity activity as business value. Don't let blended averages hide a failing cohort. Don't treat one survey respondent's score as the engagement level of an entire account. The earlier sections on funnel progression, survey bias, and data hygiene provide the controls for each failure.
Keep the operating definitions, formulas, and ownership rules in one accessible place, such as Ever Outbound's documentation, and require every new metric to pass the checklist before it reaches the executive dashboard.
Ever Outbound Inc. provides managed B2B acquisition - on a pay-per-close basis - with human research, personalized outbound, appointment setting, and a command center for tracking campaigns, replies, and booked calls. If you want customer engagement metrics tied to qualified pipeline rather than raw activity, visit Ever Outbound Inc. to explore the service and measurement approach.