November 21, 2026
Velocity in Pipeline Math That Actually Moves Revenue
Pipeline velocity equals qualified opportunities × average deal value × win rate ÷ sales-cycle days: 50 opportunities × $10,000 × 20% ÷ 60 days produces approximately $1,667 per day, not $16,667. That's expected revenue throughput, not tomorrow's bank deposit.
Say your calendar is packed, your reps are sending proposals, and the month still looks painfully light. Someone wants more leads. Someone else wants shorter sales cycles. Both sound reasonable until you discover that the busiest rep keeps booking people who can't buy.
The useful question isn't whether everyone's moving quickly. It's which part of the revenue equation needs to change, without breaking the others.
Table of Contents
- The Pipeline Velocity Formula You Can Run Today
- What a Normal Day of Pipeline Is Worth
- The Four Levers That Change the Number
- Three Pipes With the Same Math and Different Endings
- When a Faster Cycle Quietly Kills Revenue
- The CRM Audit That Proves the Number Is Real
- Pick One Lever and Rerun the Formula
The Pipeline Velocity Formula You Can Run Today
The sales floor feels busy. Discovery calls overlap, Slack notifications multiply, and the pipeline review somehow ends with the same instruction: find more deals.
Before adding activity, put the equation on screen. The Dreamdata pipeline velocity guide describes the standard calculation as qualified opportunities × average deal value × win rate ÷ average sales-cycle length. It connects opportunity volume, commercial value, conversion efficiency, and time.
Run the arithmetic before the meeting
Using the example inputs, the calculation is:
- Expected won value: 50 × $10,000 × 0.20 = $100,000.
- Daily velocity: $100,000 ÷ 60 = approximately $1,667 per day.
The arithmetic matters. A misplaced zero turns an operating metric into a motivational poster.
Pipeline velocity from four inputs
| Input | Meaning | Example | Effect if it rises |
|---|---|---|---|
| Qualified opportunities | Real deals in the pipe, not raw leads | 50 | More expected value if quality holds |
| Average deal value | Typical closed-won dollars | $10,000 | Larger daily value without more deals |
| Win rate | Share of opportunities that close | 20% | More of the same pipe turns into revenue |
| Sales-cycle length | Days from cycle start to close | 60 | A longer cycle lowers daily velocity |
| Daily velocity | (opportunities × value × win rate) ÷ days | Approximately $1,667 | The trend to watch, not a cash forecast |
Think of a freight highway. Opportunity volume is the number of trucks, deal value is the cargo value, win rate is the share that reaches the destination, and cycle length is travel time. Sending more empty trucks doesn't improve the economics.
Likewise, adding names to a spreadsheet doesn't create qualified pipeline. Shiny's guide to turning prospects into paying customers is useful when you need to distinguish prospecting activity from the stages that lead to a commercial outcome.
Lock the definitions before celebrating
Write down what makes an opportunity real. A prospect's polite reply isn't the same as an acknowledged problem, a plausible buying process, and an agreed next conversation.
Choose a consistent value basis, too. Don't mix monthly subscription fees with full project values, then congratulate the team when the average changes. Define whether a win means a signed agreement, an accepted order, or another documented commercial event.
Finally, specify the dates that start and stop the clock. Keep those definitions stable when comparing periods, and watch the trend rather than treating the result as a standalone forecast.
Practical rule: A better number counts only when the underlying definitions haven't quietly become easier.
Drop your own inputs into the table this afternoon. If outbound acquisition is part of the decision, use the cold email ROI calculator to examine the commercial assumptions alongside velocity, rather than mistaking a larger send list for a stronger business case.
What a Normal Day of Pipeline Is Worth
Shortening a sales cycle can improve throughput without changing the offer or finding another buyer. In Avoma's pipeline metrics explanation, 60 qualified opportunities, an $8,000 average deal, and a 25% win rate yield approximately $2,667 per day over 45 days, versus $4,000 over 30 days, a 50% lift with the other inputs unchanged.
The expected won value hasn't increased. The team has reduced the time needed to turn that value into revenue.
Use segment clocks, not a company-wide stopwatch
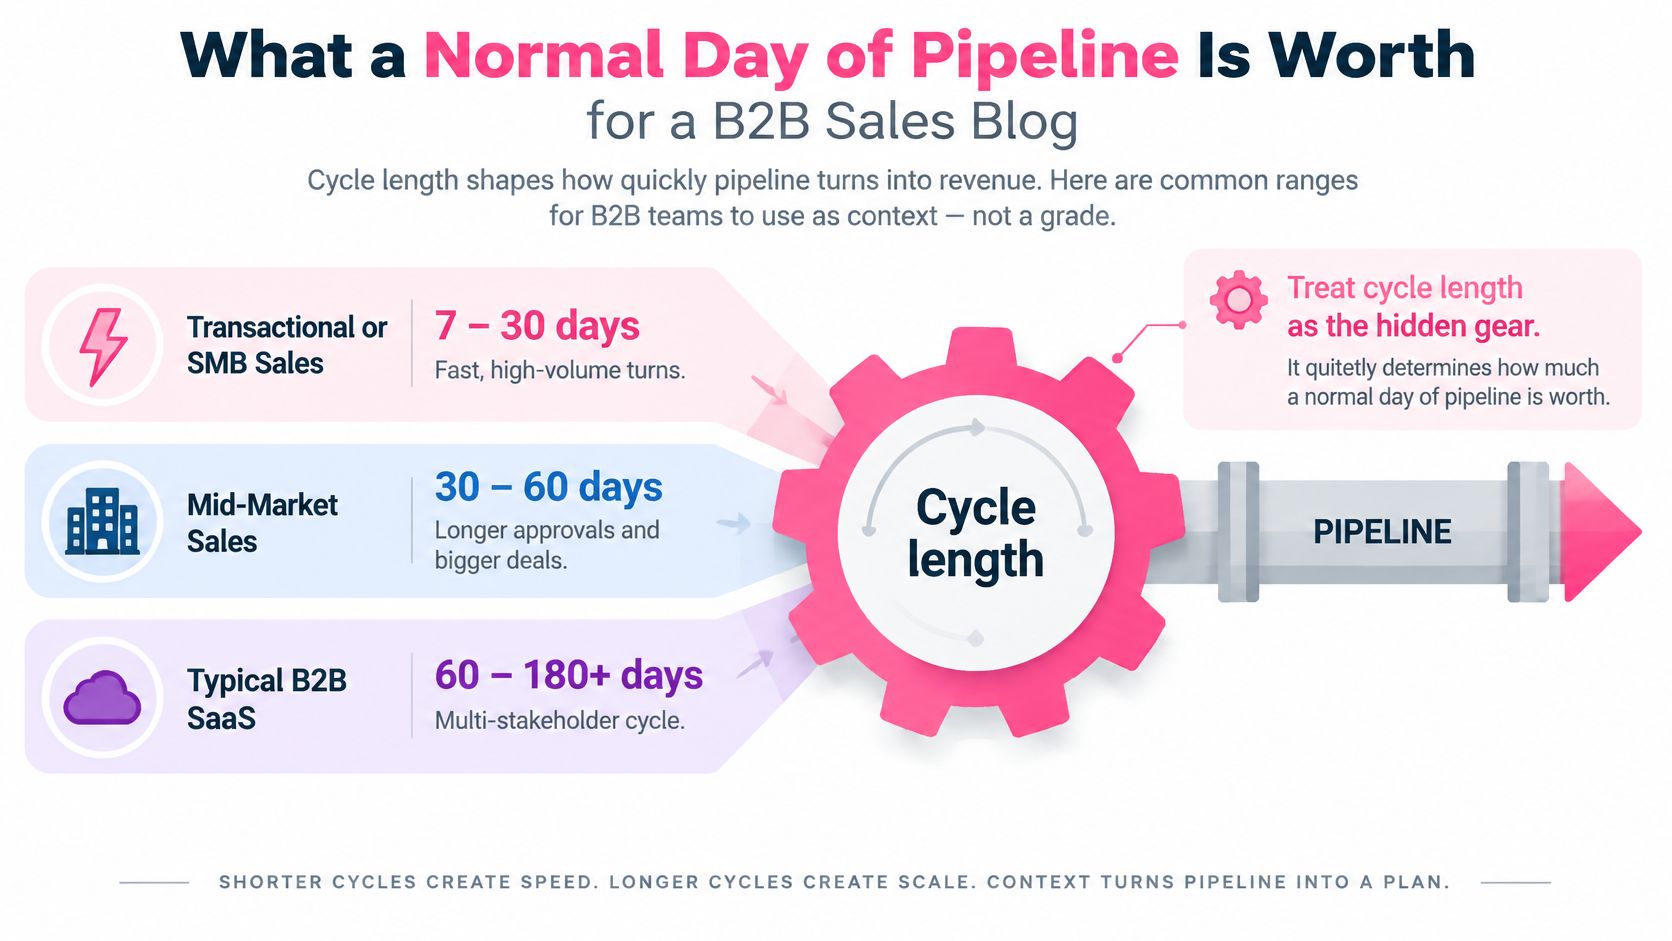
The same benchmark summary places transactional or SMB cycles at 7 to 30 days, mid-market at 30 to 60 days, typical B2B SaaS around 60 days, and enterprise at 90 days or more. Treat those bands as planning context, not report cards.
A founder selling a straightforward subscription and a consultant negotiating an enterprise engagement shouldn't inherit the same deadline just because both use Salesforce. Their buyers face different commitments, approvals, and implementation questions.
The cycle-length comparison makes that distinction visible.
Published velocity readings also differ substantially. Optifai's 2025–2026 B2B SaaS benchmark reports a median of $8,200 per day, approximately $3 million annually, across 423 companies.
Separately, Optifai's multi-industry analysis reports an average sales cycle of 57.7 days across 938 companies in six industries. First Page Sage's analysis of 247 North American B2B organizations, described by SalesScreen, reports 2025 SaaS and technology velocity of $1,847 per day, with a $12,400 average deal, 22% win rate, and 67-day cycle.
Sales-cycle bands and what they do to daily velocity
| Segment or case | Cycle length | Daily velocity | What changed |
|---|---|---|---|
| Transactional or SMB | 7–30 days | Calculate using qualified volume, value, and win rate | Speed is useful if deals stay qualified |
| Mid-market base case | 45 days | $2,667 | 60 opportunities, $8,000 deals, 25% win rate |
| Same mid-market, faster close | 30 days | $4,000 | Only cycle length changed, a 50% lift |
| Typical B2B SaaS | About 60 days | Lower than a 30-day motion with identical other inputs | Planning context, not a target |
| Enterprise | 90 days or more | Lower on identical deal math | Buying-group approvals shape the clock |
| Optifai B2B SaaS median | Not specified for this median | $8,200 | 423 companies, 2025–2026, about $3 million annually |
| Optifai multi-industry average | 57.7 days | Not supplied for this cycle analysis | 938 companies, cycle input only |
| First Page Sage SaaS and technology | 67 days | $1,847 | $12,400 deal, 22% win rate, 247 organizations |
Find the lane that's actually stuck
Neither published velocity figure is a universal target. Opportunity count remains part of the equation, and these aren't interchangeable samples.
Split your dashboard by segment, source, and deal size. Track qualified opportunities created, average closed-won value, opportunity win rate, and creation-to-close time within each group.
Then inspect acquisition economics with the meeting cost calculator. A cheap calendar booking can still be expensive if the buyer never progresses.
A blended average can hide a fast SMB lane beside a stalled enterprise lane. Manage the lanes separately, or you'll prescribe more traffic when the enterprise team needs an approval plan.
The Four Levers That Change the Number
A thin calendar and a crowded proposal queue aren't the same problem. Giving both teams a larger prospect list is like handing everyone in a restaurant another frying pan, including the person waiting for the delivery truck.
Start with the visible symptom, then choose the input you can change.
Which lever a thin calendar needs
| Symptom | Lever | Move | Failure if forced |
|---|---|---|---|
| Empty calendar | Qualified opportunity volume | Targeted conversations with people who can buy | Unqualified names inflate volume and cut win rate |
| Discounts and stalled proposals | Average deal value | Change packaging, scope, or buyer | A hopeful CRM line doesn't raise value |
| Late-stage losses | Win rate | Match the offer and earn the next conversation | Skipping fit to look faster lowers conversion |
| Open deals with no next meeting | Sales-cycle length | Book the next step and name the blocker | Waiting lengthens the cycle while stage changes disguise inactivity |
Give each lever a specific job
Volume should add commercially credible opportunities. If reps finish discovery calls without understanding why the buyer would act, increasing bookings will mostly increase the number of unresolved conversations.
Deal value should reflect an offer the buyer wants and can approve. Combine implementation with ongoing support when that solves a real problem, or narrow an oversized proposal when the buyer needs a smaller starting commitment. Don't increase the amount field because the quarter needs encouragement.
The diagram separates each lever's job from the failure mode that makes it look productive.
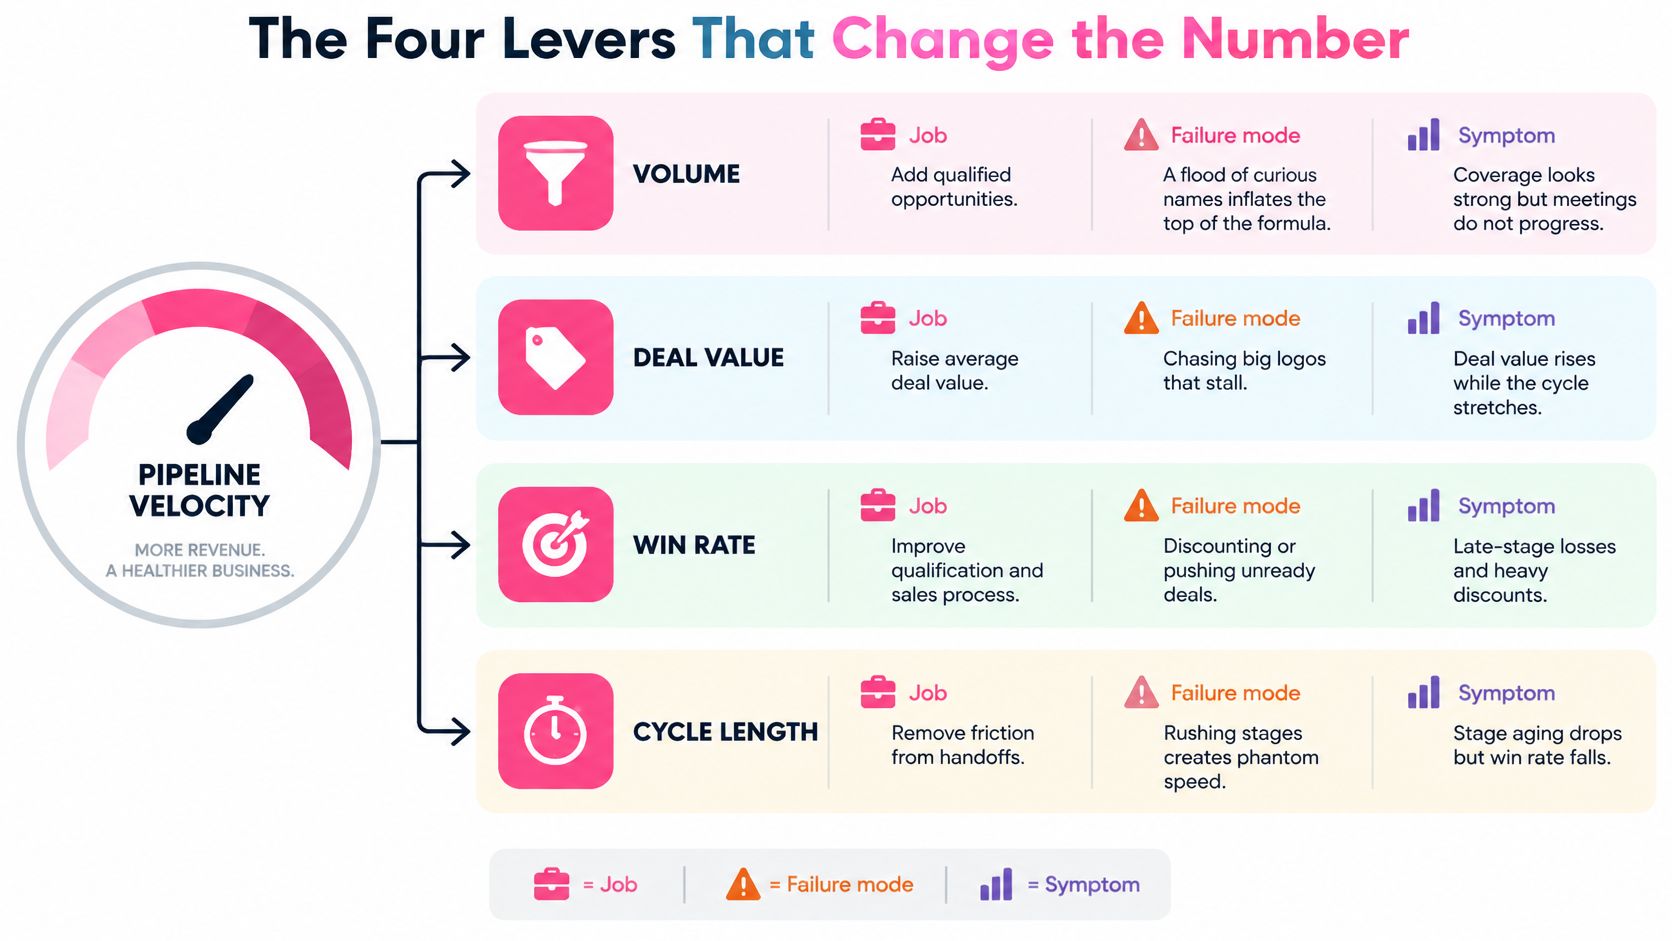
Win rate improves when the buyer's problem, the offer, and the buying process align. Ask what would prevent a purchase before writing a proposal, not after the buyer has disappeared.
Cycle length is the lever for removing avoidable waiting. Assign an owner to unanswered questions, arrange the next conversation while everyone's present, and send the information the buying group needs to proceed.
Protect the buyer's limited attention
Gartner's B2B sales research finds that buyers spend 17% of their purchase time meeting potential suppliers, and just 5% to 6% with any one sales representative when comparing several suppliers. You don't get much room for a generic pitch.
Make the first reply operationally urgent. Route interested responses to a named owner, acknowledge the buyer's actual question, and offer an appropriate next step instead of dropping everyone into another automated sequence.
For a lead-response scenario, the distinction is practical: a buyer who asks about integration needs an integration answer before a calendar link. Fast handling should help them qualify the offer, not merely move them into a meeting.
Use meeting-ready lead criteria to frame the handoff between outreach and sales. Match this week's symptom to a lever, assign an owner, and resist changing every input at once. Otherwise, even a better result won't tell you which decision worked.
Three Pipes With the Same Math and Different Endings
These are hypothetical illustrations, not benchmarks. Each team has a plausible pipeline and a different constraint, so each needs a different intervention.
The agency with an overflowing calendar
Say an agency has 40 opportunities, $6,000 deals, a 15% win rate, and a 40-day cycle. Its arithmetic is 40 × $6,000 × 0.15 = $36,000 in expected wins, divided by 40 days, or $900 per day.
The founder keeps taking introductory calls with businesses that like the portfolio but don't need the service urgently. The fix isn't another sending domain. It's a clearer offer and a stronger fit test before the proposal.
For a one-input illustration, keep volume, value, and cycle unchanged and raise win rate to 20%. Now 40 × $6,000 × 0.20 ÷ 40 = $1,200 per day. That assumes the existing opportunity pool can convert better through improved offer fit and selling, not that disqualifying prospects magically leaves volume unchanged.
The SaaS team waiting on approval
A hypothetical SaaS team has 30 opportunities, an $18,000 average deal, a 25% win rate, and a 90-day cycle. That produces $135,000 in expected wins, divided by 90, or $1,500 per day.
The buyers are credible, but security questions arrive late and the economic buyer hasn't joined the conversation. Offering a discount won't complete the security questionnaire.
Keep the other inputs fixed and shorten the cycle to 60 days through earlier review and a mutual action plan. The calculation becomes 30 × $18,000 × 0.25 ÷ 60 = $2,250 per day.
The consultancy that needs more of the right buyers
A consulting firm with 20 opportunities, $25,000 deals, a 40% win rate, and a 50-day cycle produces 20 × $25,000 × 0.40 ÷ 50 = $4,000 per day.
Its partners sell effectively when they meet a suitable buyer. The constraint is access, not persuasion. A targeted acquisition motion is more appropriate than rewriting a proposal template that already works.
Increase only qualified opportunities to 30, preserving the other assumptions, and the result becomes $6,000 per day. The qualification condition matters: adding poor-fit prospects would invalidate the held-constant win-rate assumption.
Choose the story that resembles your constraint, not the one with the biggest daily number.
When evaluating performance-based lead generation, connect the commercial model to the input you need to improve. Pick the closest story and work on that constraint for a month, rather than borrowing every tactic from all three.
When a Faster Cycle Quietly Kills Revenue
Give credit to the team that takes longer to qualify a deal and earns more from the resulting opportunities. In a hypothetical sales review, the rep who pauses a proposal to involve finance may be doing better commercial work than the rep who advances every enthusiastic user to negotiation.
The leaderboard might disagree. The signed contracts might not.
A shorter cycle is useful only when the team preserves enough deal value and conversion to make the change worthwhile.
Recognize phantom speed
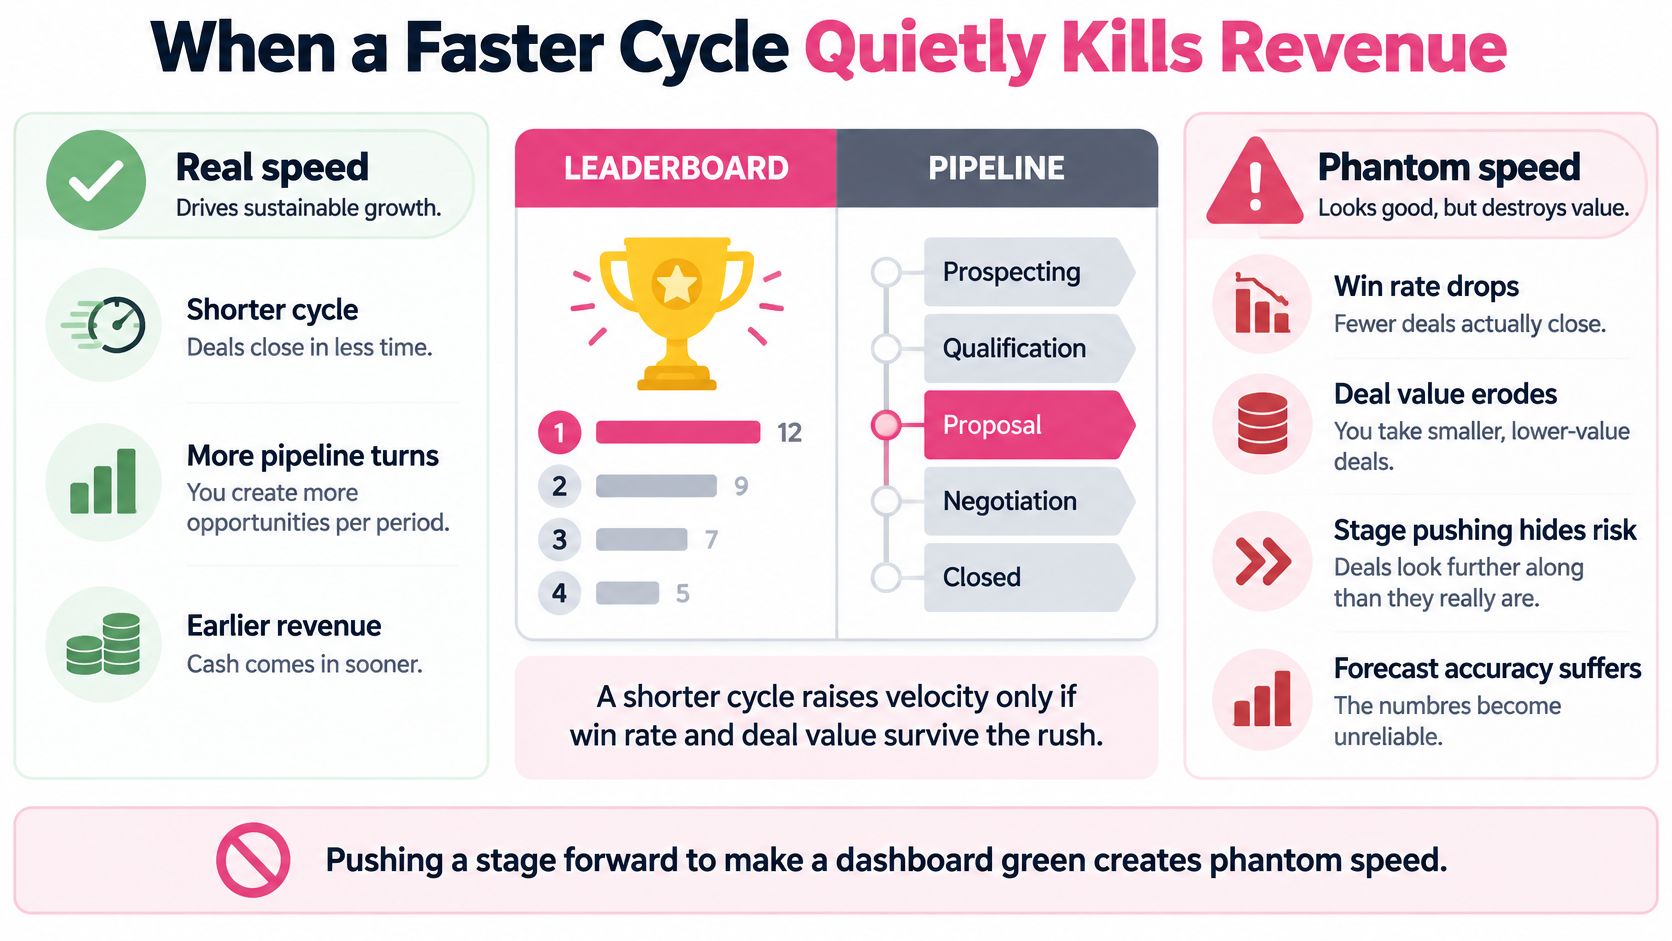
A rep sends a proposal before confirming budget, advances the opportunity, and reports faster stage progression. The buyer still hasn't secured approval. The rep has changed the record, not the buying process.
That distinction becomes especially important with buying groups. In the 2025 B2B buyer study published by Mixology Digital, 76% of B2B buyers said more than three people participate in the decision, while 22% reported six to ten participants.
An enthusiastic user can agree to a demo while security, procurement, and the economic buyer remain uninvolved. Treating that enthusiasm as approval creates a proposal that looks advanced but can't close.
The comparison below separates removed friction from skipped buying work.
Cut waiting, not qualification
Use different tests for safe and unsafe acceleration:
- Safe cuts: Answer promptly, reduce internal handoffs, agree on a mutual close plan, and define what evidence permits stage entry.
- Unsafe cuts: Skip discovery, conceal an unresolved budget question, or count a booked meeting as a qualified opportunity.
- Buyer evidence: Confirm who approves, what they need to review, and which dependency must be resolved before the next commitment.
When velocity changes, separate volume, value, win rate, and time effects. Hold the other inputs constant in a comparison calculation, replace the input you're investigating, and inspect its contribution. If several inputs changed, document those changes together rather than crediting the entire improvement to speed.
A slower, properly qualified pipeline can outperform a faster, poorly qualified one because a higher win rate can more than offset additional time. Equally, a shorter cycle can conceal falling deal value if reps buy speed through discounts.
There's no universal good velocity in pipeline management. There's an economic result for a defined segment, produced by identifiable inputs. Refuse a cycle-reduction goal that doesn't also hold win rate flat or better, and check that deal value hasn't paid the bill.
The CRM Audit That Proves the Number Is Real
Analysis summarized in Airspeed's CRM forecasting article found 22% forecast error among teams below 70% field completion, compared with 8% among teams above 90% completion. Its 2025 research summary also reports that 76% of CRM users considered less than half their data accurate and complete, while only 45% of sales leaders and sellers expressed high confidence in forecast accuracy.
Say your reported velocity jumps after a cleanup. It could mean better execution. Or a manager deleted slipped deals, pushed close dates forward, and allowed a new rep to classify every positive reply as an opportunity.
The audit starts with the records, not the dashboard.
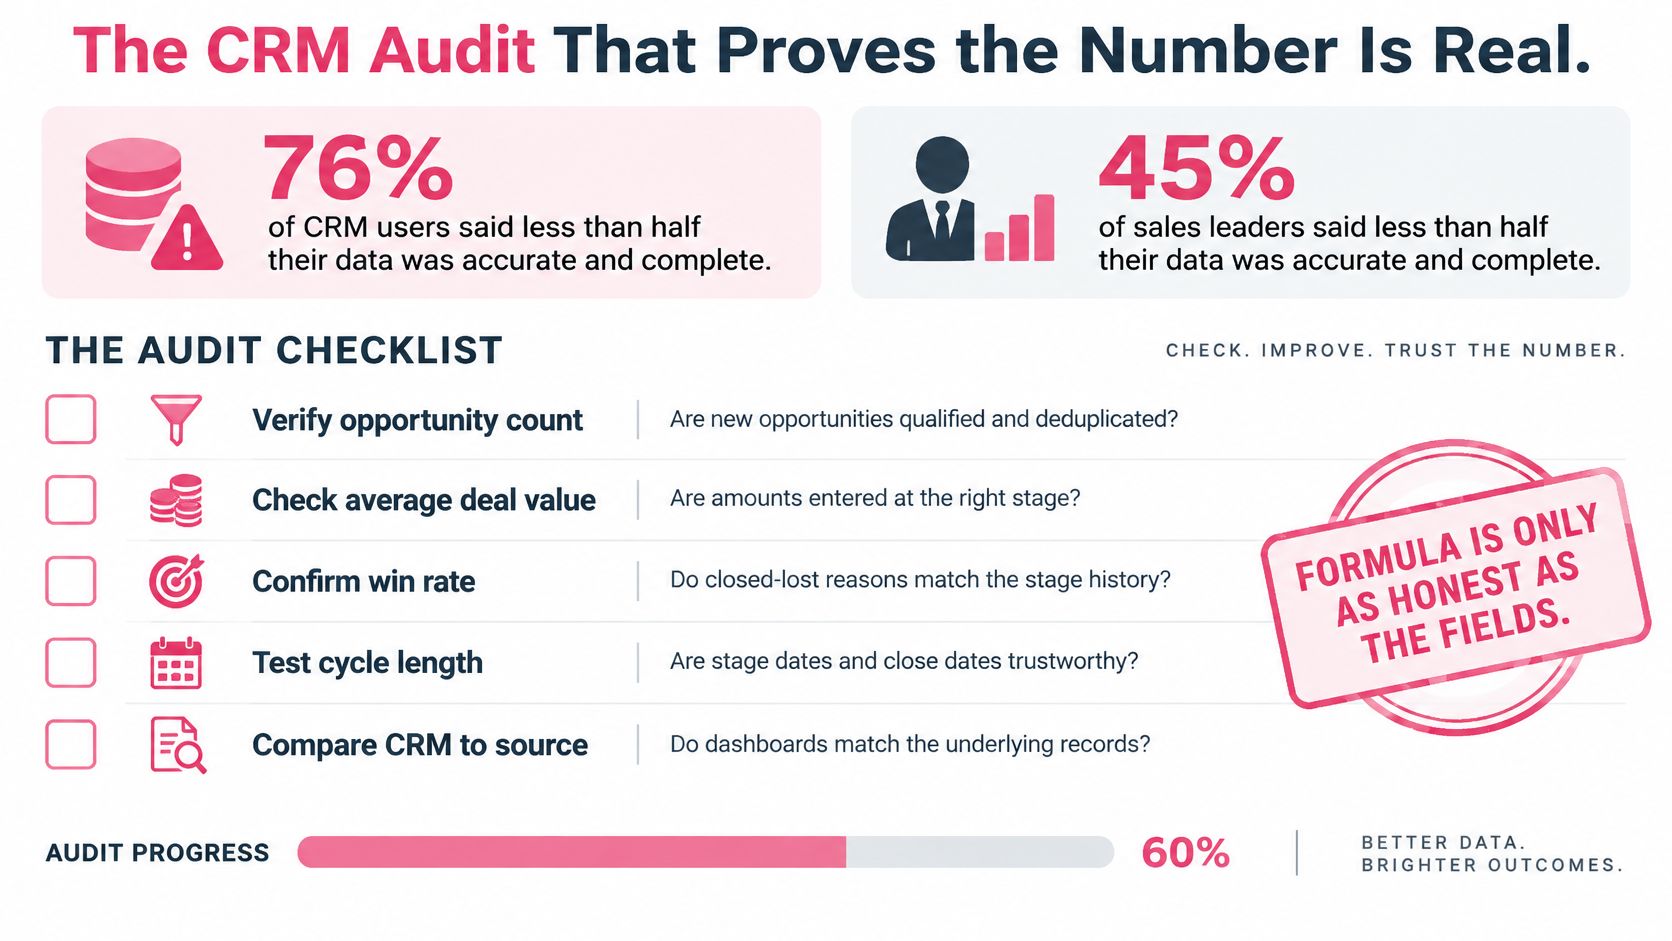
Run a pass-fail inspection
- Freeze opportunity-created dates. Preserve the original timestamp and restrict editing permissions. Record corrections separately so nobody can shorten the apparent history by recreating a deal.
- Write stage-entry rules a stranger could apply. Replace subjective confidence with evidence, such as a confirmed business problem or an agreed commercial review.
- Require a next step and date. Every open opportunity needs an owner, an action, and a scheduled checkpoint. “Following up” isn't a complete plan.
- Review close dates weekly. Explain each slip and retain the opportunity as open unless there's evidence for a won or lost outcome.
- Report complete cohorts. Group opportunities by their creation period and retain won, lost, and delayed outcomes. Don't judge performance only from the survivors left on screen.
- Reconcile activity with revenue records. Match campaign replies and calendar bookings to qualification, opportunity creation, progression, and closed revenue. A booked call should have an identifiable outcome.
Check the trail behind the total
Open Salesforce or HubSpot and select individual records behind the report. Compare the amount with the signed agreement, inspect stage history, and confirm that losses haven't vanished from the calculation.
Keep separate clocks where they answer different questions. First-meeting-to-close time helps evaluate a handoff; opportunity-creation-to-close time measures the defined opportunity cycle. Don't swap them between reporting periods.
Use this video as a discussion aid while reviewing how your team records pipeline movement.
The number passes only if a skeptical finance partner can reconstruct it. A polished chart isn't evidence when the underlying records tell a different story.
Pick One Lever and Rerun the Formula
Make a 30-day operating decision, not a permanent declaration that sales needs more leads. The point is to produce a comparison you can trust and a change you can explain.
Commit to a controlled rerun
- Write this week's inputs. Record qualified opportunities, average deal value, win rate, and cycle length in days, with the reporting segment and definitions attached.
- Compare with last month. Circle the input that deteriorated or failed to improve. Check whether another input changed enough to explain the result.
- Resolve audit failures first. Freeze qualification and measurement rules before increasing spend.
- Match the intervention. For a volume gap, reach buyers with a specific offer. For a value gap, revise scope, packaging, or buyer selection.
- Protect conversion. If win rate is the weakness, examine offer fit and stage evidence. If time is the weakness, give the buying group a dated close plan.
- Rerun in 30 days. Use the same definitions, record the intervention, and retain delayed deals rather than removing inconvenient outcomes.
Use the outbound volume planner when qualified opportunity supply is the constraint. Plan toward suitable conversations, then log each resulting opportunity under the audited rules.
Tie acquisition work to commercial outcomes
At Ever Outbound Inc., we're pay-per-close: our monthly infrastructure fee is $497, and the 5% fee on closed deal value is charged only when the client wins. We can scale a client's outreach to 3x their pipeline without hiring a single SDR or buying a single ad, but your reporting should still distinguish activity from qualified opportunities and closed revenue.
Jake, Co-founder of Barrel Aged Ecommerce, described our pay-per-close work this way: “Two months in with Everoutbound and we're booking meetings consistently. They handle list building and copy and send around 1,400 emails a day for us, so our team can spend its time on sales calls instead of prospecting.…”
That account describes execution and a division of labor, not a velocity benchmark. Your result is the audited rerun: what entered the pipeline, what converted, what it was worth, and how long buyers took.
At Ever Outbound Inc., we're pay-per-close, with done-for-you B2B prospect research, outreach, reply handling, qualification, and appointment setting. If qualified opportunities are your missing lever, visit us to discuss a campaign your team can evaluate against closed revenue, not just a busier calendar.